Sellers, Buyers and Housing Supply
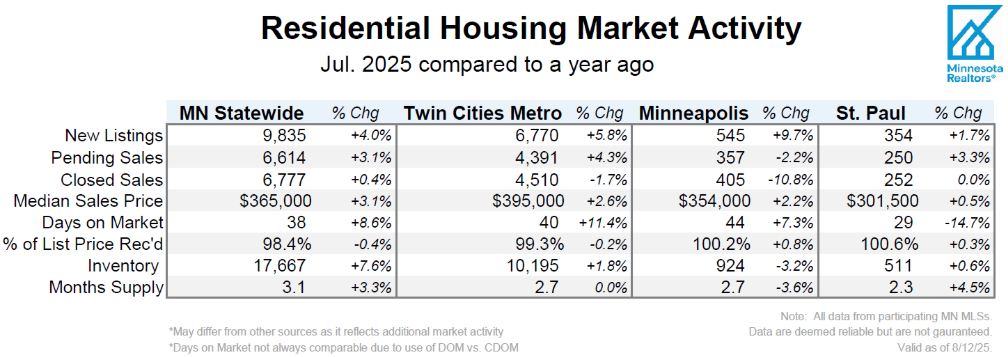
It’s no secret that buyers have faced headwinds over the last few years. And despite a hot, wet and smoky month, July delivered further gains in buyer and seller activity. Both listing and sales activity were up slightly more in the metro than statewide. Listings were up 4.0% statewide and 5.8% in the metro; sales rose 3.1% statewide and 4.3% in the metro. The fact that 2025 listing activity is increasing more than sales has pushed inventory levels higher for 24 consecutive months statewide and 21 straight months in the metro. Even with more homes for sale, both the state and metro remain sellers’ markets with 3.1 and 2.7 months of supply respectively. Between five and six months of supply usually indicates a balanced market that isn’t favoring buyers nor sellers.
Many parts of the economy from housing and beyond are “rate-sensitive” nowadays. The 30-yr mortgage rate averaged 6.72% in July but so far in August it’s averaging 6.58%. That’s down from about 6.82% in both May and June, partially reflecting a slowdown in job growth. “The shift in mortgage rates is promising and we’re already hearing about sidelined buyers preparing to resume their searches if the trend continues,” said Patti Jo Fitzpatrick, President of Minnesota Realtors®. “The fact that they’ll likely have more inventory that could meet their needs is another positive, but affordability concerns certainly haven’t gone away.”
Based on analysis of about 96% of statewide data, existing home sales rose 6.6% while new home sales fell 3.2%. Sales of single family homes rose 8.3%, condo sales declined 3.9% and townhome sales fell 4.8%. Activity also varied significantly by price point. Sales under $500K were up 3.2%; sales between $500K-1M rose 16.7%; sales over $1M slipped 0.4%. Second-time and luxury buyers tend to be less sensitive to interest rates than other buyers and move-up buyers have equity from their previous home to roll into the next. “There are always key differences across the various market segments,” said Jennifer Livingston, President of the Saint Paul Area Association of REALTORS®. “If we see rates continue to improve, expect more buyer activity assuming we have the inventory available and the economy remains resilient.”
Prices, Market Times and Negotiations
“It’s tempting to think that supply and demand are the only factors driving home prices,” said Frank D’Angelo, President of Minneapolis Area REALTORS®. “But move-up buyers looking for more space and higher-end sales are making up a larger share of the pie, and that product mix also impacts home prices.” After cooling off slightly from all-time highs in June, the July median home price rose 3.1% to $365,000 statewide and 2.6% to $395,000 in the Twin Cities year over year. Based on current mortgage rates and estimated property tax and insurance costs, the typical monthly payment on the median-priced Twin Cities home is roughly $2,900 per month. That’s about $1,100 more per month than in 2021—an increase equal to nearly 10% more of the metro’s $125,000 median family income.
Sellers needed a bit more patience than last year. For the vast majority of statewide activity, homes sold in 46 days, while Twin Cities homes took 40 days to go under contract (using cumulative days on market). Across the state, sellers accepted offers at 98.4% of their original list price compared to 99.3% in the metro. For both market times and offers, this can vary widely based on price point, location, market segment and even variables like listing photos and pricing strategy. For example, single family homes sold in 34 days, but condos took 88 days in the metro area. Newly built homes sold in 75 days while existing homes took 37 days to sell. Homes under $500,000 sold in 38 days while $1M+ properties spent 80 days on market. Previously owned single family homes continue to be the hottest commodity.
The latest economic data showed a notable slowdown in the labor market. Since housing depends on potential buyers being gainfully employed, deterioration in the labor market is unsettling. But the housing market is “rate dependent,” rates are “Fed dependent,” and the Fed is “data dependent.” And if the data points to a cooling economy or even a possible recession, the Fed is likely to cut rates which could actually spur housing demand from buyers discouraged by the lack of affordability and current rate environment. In other words, though it may seem counter intuitive, an economic slowdown could actually help some home buyers.
All information is according to Minnesota Realtors® based on data from NorthstarMLS and participating MLSs.
Data are deemed reliable but not guaranteed. MNR serves the entire state of Minnesota.
MAR and SPAAR serve the Twin Cities metro and western Wisconsin.
#MNRPressRelease